

Gene Set Enrichment and KEGG Pathway Analysis Using ClusterProfiler
- Client or Institution: Paper Reproduction / Internal Project
- Project Goal: Conduct KEGG-based gene set enrichment analysis from DESeq2 results using ClusterProfiler, and visualize enriched biological pathways to gain insight into Alzheimer’s disease
- Tools Used: R (ClusterProfiler, enrichplot, pathview), Python, TargetScan, miRNet
- Duration: 1 week
- Outcome: Visualized activated/suppressed pathways and biological processes in Alzheimer’s vs control samples
- Dataset: GSE53697
- Repository: GitHub Repo
A Visual Dive Into Enriched Pathways in Alzheimer’s Disease
Abstract
This project involved Gene Set Enrichment Analysis (GSEA) and KEGG pathway analysis on RNA-Seq data from the GSE53697 dataset. Using differential expression results from DESeq2, enriched pathways were identified using ClusterProfiler and visualized with ridge plots, dot plots, GSEA curves, and KEGG pathway diagrams. The goal was to understand how Alzheimer’s disease affects biological systems at the pathway level.
🧠 Background & Problem Statement
While differentially expressed genes offer valuable information, they can be difficult to interpret in isolation. Gene Set Enrichment Analysis (GSEA) addresses this by looking at the collective behavior of genes within known pathways, revealing higher-order insights. This is particularly important for diseases like Alzheimer’s, where multiple regulatory systems are disrupted.
The challenge was to:
- Transition from gene-level statistics to pathway-level interpretation
- Detect activation/suppression patterns using statistical enrichment
- Communicate results through compelling visualizations
🗂 Dataset Summary
GSE53697 is a human brain transcriptomics dataset containing expression profiles of Alzheimer’s and control subjects. It is available via the NCBI GEO Database.
- Platform: Illumina HiSeq 2000
- Samples: Human brain tissue (Alzheimer’s and control)
- Readout: Raw gene expression counts
- Use Case: Alzheimer’s disease biomarker discovery
⚙️ Methodology
- Input: DESeq2 differential expression results (gene names, log2FC, padj)
- Enrichment Tool: ClusterProfiler (R Bioconductor)
- Databases Used:
- KEGG (Kyoto Encyclopedia of Genes and Genomes)
- GO (Gene Ontology, optional)
- Gene Ranking: Based on log2 fold change for GSEA
- Filtering: Significant genes (
padj < 0.05,|log2FC| > 1) - Visualization Tools:
enrichplotfor dot and ridge plotspathviewfor KEGG diagramsGSEAplotfor enrichment curves
📊 Key Visualizations
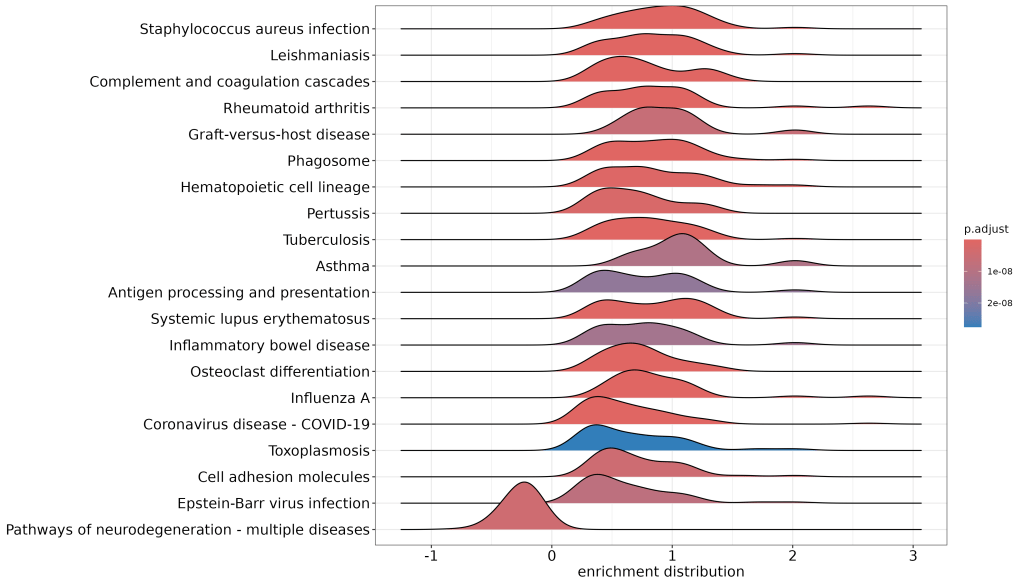
🔹 Ridgeplot
Shows distribution of enrichment scores across multiple KEGG pathways, colored by adjusted p-value.
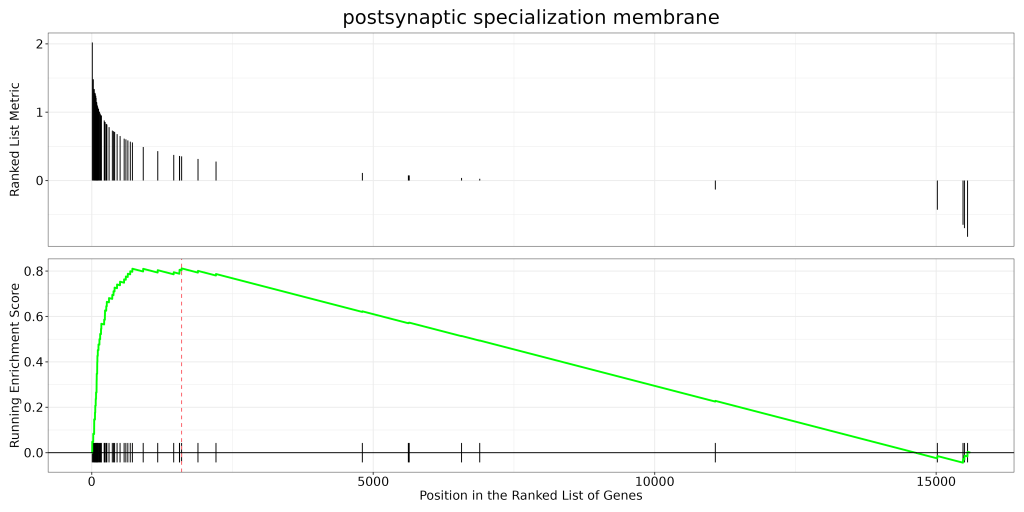
🔹 GSEA Enrichment Curve
Shows the enrichment score of a specific pathway (e.g., postsynaptic specialization) across a ranked gene list.
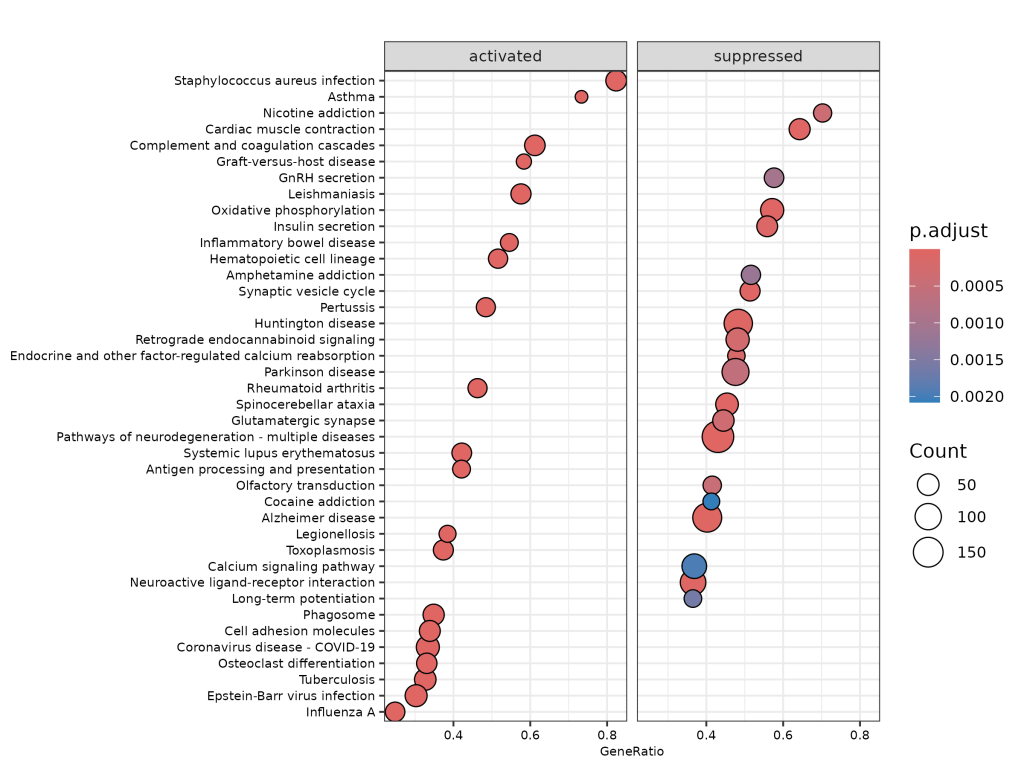
🔹 Dotplot (Grouped)
Highlights pathways that are activated or suppressed, along with gene ratios and p-adjusted values.
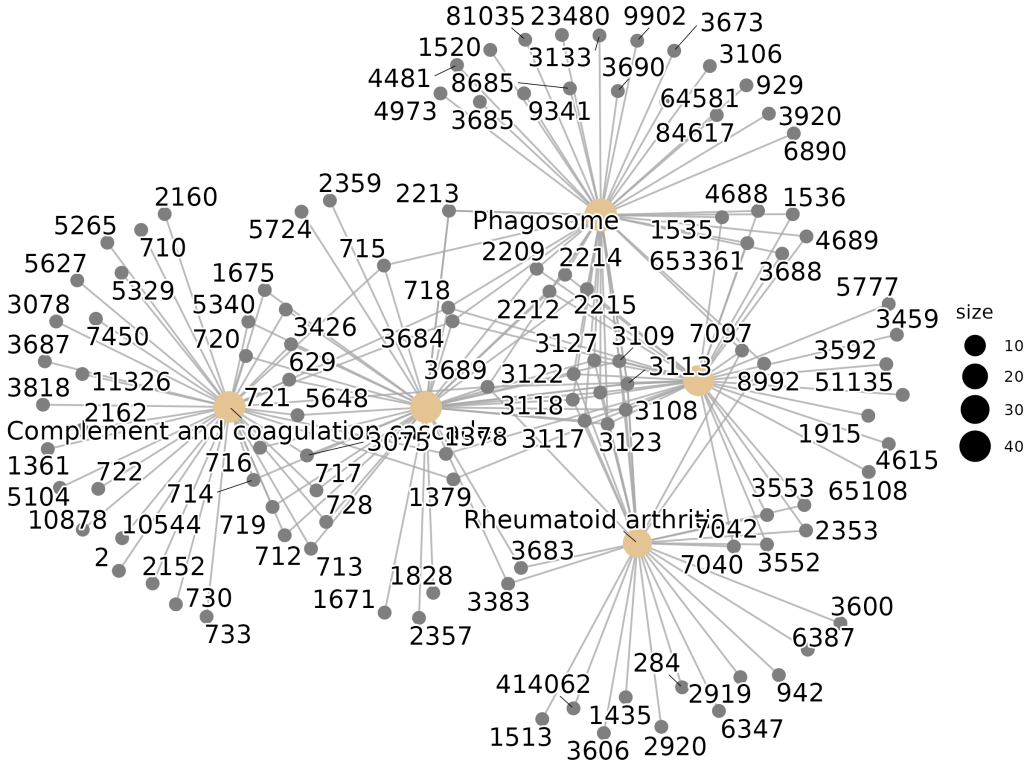
🔹 Category–Gene Network (Cnetplot)
Visualizes how genes are shared across multiple KEGG pathways.
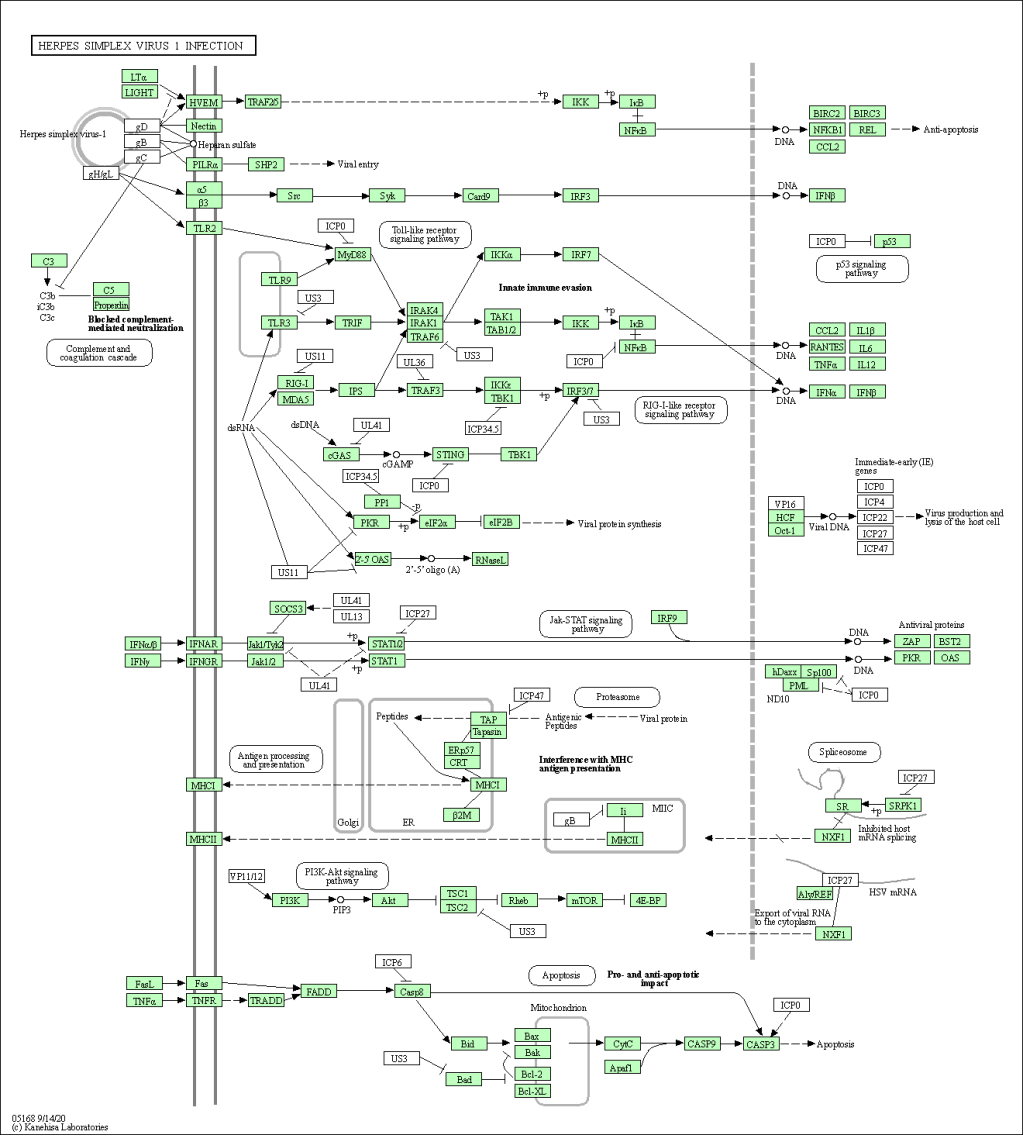
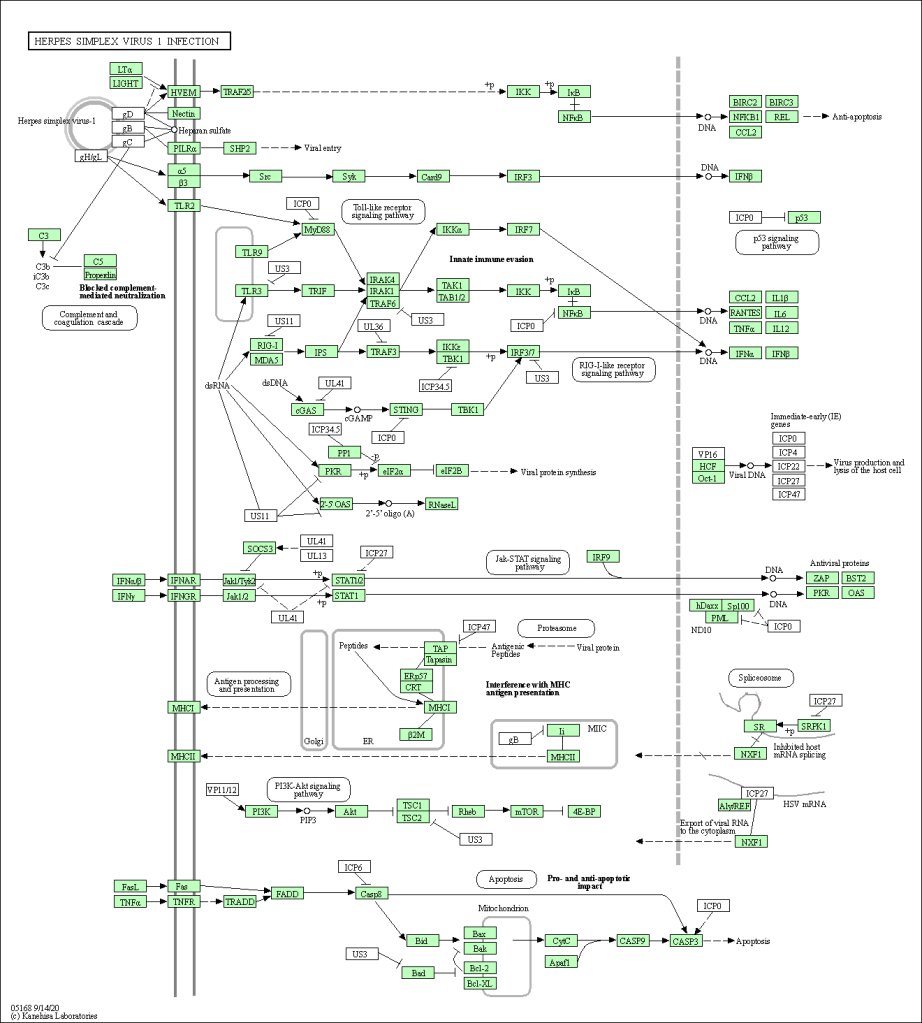
🔹 KEGG Graph Overlay
Annotated KEGG pathway showing hit genes overlaid (green).
📈 Outcome
- Top enriched pathways include:
- Complement and coagulation cascades
- Synaptic signaling and immune regulation
- Pathways in neurodegeneration (Alzheimer’s, Parkinson’s)
- Visuals generated:
- Ridgeplots for significance trends
- Dotplots for gene ratio and p-value
- KEGG diagrams to link genes with known interactions
- Deliverable ready for publication, teaching, or collaboration
💡 Lessons Learned
- Gene-level statistics are powerful—but pathway-level views unlock better biological meaning
- ClusterProfiler is versatile for both over-representation and GSEA
- KEGG maps provide intuitive biological context, especially for non-experts
- Ridgeplots and category networks help highlight theme clusters among enriched results
💬 Discussion
Pathway analysis transforms flat DEG tables into meaningful biological stories. In this project, GSEA revealed widespread immune activation, neuroinflammatory signatures, and viral infection pathway enrichment in Alzheimer’s samples. These results complement existing literature and could be used to formulate hypotheses for further validation.
The code structure and figures were designed for reproducibility and clarity—making it easy to reapply the pipeline to any DESeq2 result set.
📣 Call to Action
Have DESeq2 results you want to translate into meaningful biology?
📊 I can help you run GSEA, create publication-ready figures, or build an interactive dashboard.
Or do you have raw data but don’t know where to begin?
💬 Start a conversation to get your enrichment analysis done right.
🔭 Future Directions
- Automate pathway report generation from
.csvor.rds - Include Reactome and GO terms in future releases
- Add GSEA-based meta-analysis support
- Integrate with miRNA and transcription factor databases for regulatory overlay

Leave a comment