Dynamic Shiny Dashboard for the Visualization of DESeq2 Results
- Client or Institution: Internal / Random Project
- Project Goal: Provide an interactive dashboard for dynamic exploration of DESeq2 differential expression results through various biological and statistical visualizations
- Tools Used: R, DESeq2, Shiny, ggplot2, pheatmap
- Duration: 2 weeks
- Outcome: A fully functional Shiny application to explore and interpret differential gene expression (DGE) analysis outputs
- Live App: Try the Dashboard
Interpreting Differential Expression Data Has Never Been This Intuitive
Abstract
Interpreting gene expression data post-DESeq2 analysis can be overwhelming—especially for those without programming experience. This project tackles that challenge by delivering a web-based Shiny app where users can upload their DESeq2 results and explore the data through rich interactive visualizations. From volcano plots to dispersion trends and gene-level histograms, the app provides the tools needed for deeper, faster insights.
🧠 Background & Problem Statement
Differential gene expression (DGE) is a key method in genomics for identifying genes with significant changes in expression under different conditions. Tools like DESeq2 perform the statistical groundwork, but interpreting the results often requires custom plotting in R.
This project answers the question:
How can we turn DESeq2 output into an interactive exploratory experience for both bioinformaticians and biologists?
Thank you for the clarification! Here’s the corrected version of that section with your intent properly reflected:
💡 What Makes This Dashboard Different?
Unlike other tools that allow data uploads, the Dynamic Shiny Dashboard is preloaded with a DESeq2 results object. The goal is not general upload-based exploration, but to showcase how DESeq2 output can be packaged and shared with collaborators, clients, or stakeholders.
This project demonstrates how to:
- Build a complete R Shiny dashboard around DESeq2 results
- Deliver interactive data exploration tools using a preprocessed
.rDataobject - Facilitate communication of results to third parties with no R skills or installation needed
This approach is especially powerful for:
- Bioinformatics consulting deliverables
- Team collaboration and result reviews
- Public repositories or supplementary publication dashboards
🗂 Dataset
- Input Format: DESeq2 result tables (CSV or TSV) with columns such as
log2FoldChange,pvalue,padj, and gene identifiers - Sample Data Used: Simulated RNA-seq differential expression datasets
- Preprocessing Expectations: Data should be pre-processed via DESeq2 and exported as a flat table
⚙️ How the App Works
Once DESeq2 result data is uploaded, the dashboard reveals a series of modular tabs and widgets:
🔬 Volcano Plot
- Visualize
log2FoldChangevs-log10(padj) - Interactive thresholds for fold change and p-value
- Hover to inspect gene identifiers
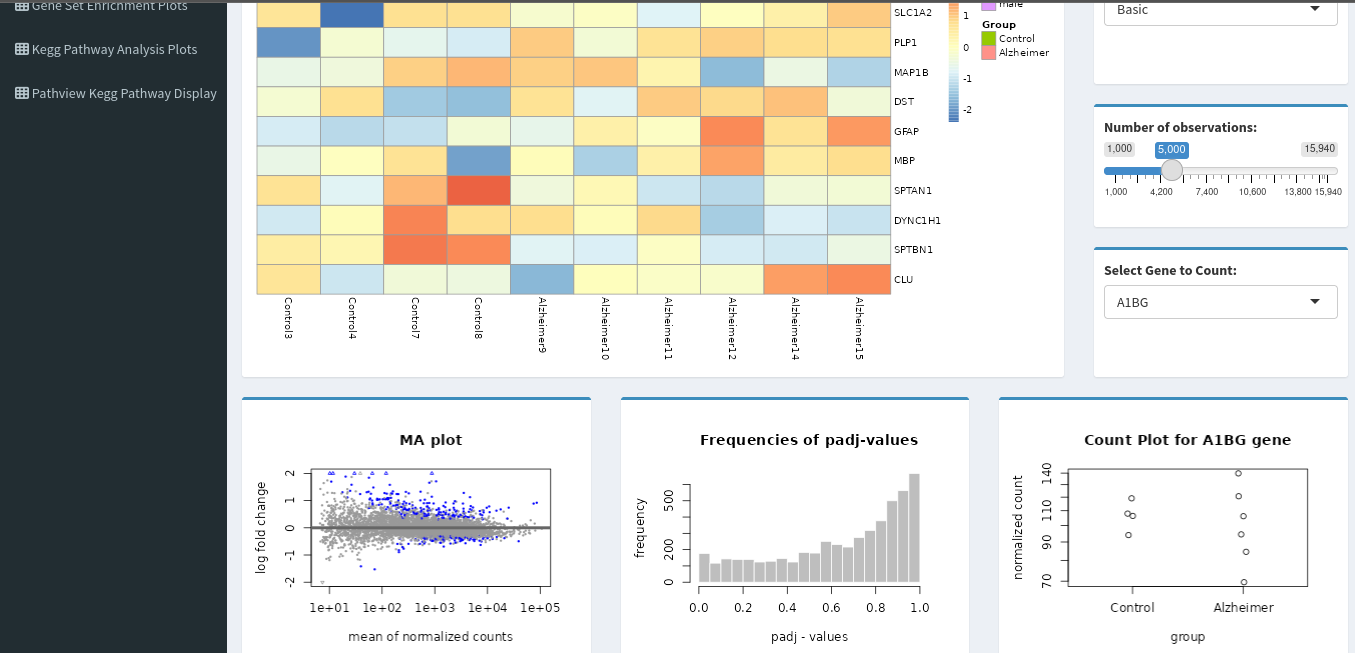
🔥 Heatmap
- Show expression patterns across samples
- Hierarchical clustering
- Toggle between top N significant genes
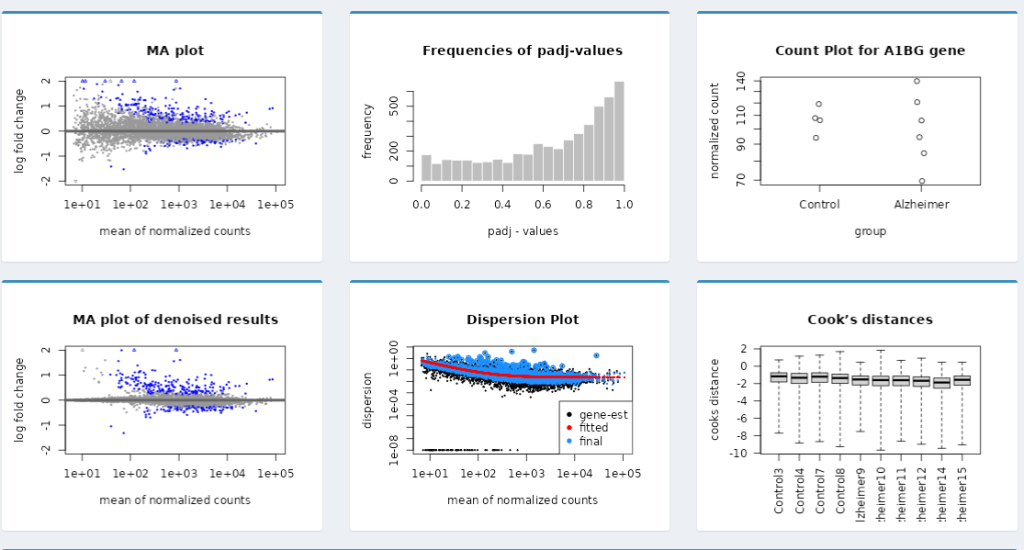
🧮 MA Plot
- Mean expression vs fold-change visualization
- Easily detect low-count or high-variance genes
📈 Dispersion Plot
- View dispersion estimates vs mean normalized counts
- Helps validate the reliability of expression calls
🎯 Dotplots & Histograms
- Distribution of
log2FoldChange,padj, or any selected variable - Dotplots grouped by gene category or condition
📦 Boxplots
- Compare normalized expression values across experimental groups
📈 Key Results
- ✅ Live interactive dashboard hosted on ShinyApps.io
- 📊 Visual exploration of differential expression data without writing R code
- 🔍 Enhanced understanding of gene behavior under different biological conditions
- ⚙️ Supports major DESeq2 visualization standards in a user-friendly format
💡 Lessons Learned / Innovations
- Built a flexible Shiny app template that can be extended to other omics datasets (e.g., edgeR, limma, microarray)
- Ensured that plots dynamically respond to user input—making exploration feel responsive and customized
- Modularized code for reusability in future DE pipelines or teaching tools

Leave a comment