
Dynamic Exploratory Data Analysis with Streamlit
- Client or Institution: Internal / Random Project
- Project Goal: Create a user-friendly web app for dynamic exploratory data analysis (EDA) of any tabular dataset with numeric and categorical features
- Tools Used: Python, Pandas, Scikit-learn, Seaborn, Streamlit
- Duration: 1.5 weeks
- Outcome: Interactive Streamlit app that supports comprehensive univariate, bivariate, multivariate, and dimensionality-reduction visualizations
- Live App: Visit Streamlit App
- GitHub: Source Code
Upload. Explore. Visualize. Understand. All in One Click.
Abstract
The Dynamic Exploratory Data Analysis app empowers users—regardless of coding skill—to perform meaningful EDA by simply uploading a CSV file. Built with Streamlit, the app intelligently detects data types and offers insightful plots across several tabs: Univariate, Bivariate, Multivariate, and PCA.
The app allows analysts, students, and researchers to visualize trends, detect patterns, identify class imbalance, and uncover dimensionality relationships—all in a few clicks.
🧠 Background & Problem Statement
Exploratory Data Analysis (EDA) is often a repetitive and time-consuming task, especially when using notebooks. Many professionals struggle to scale it across projects or explain the results to non-technical audiences. This project eliminates those hurdles by delivering a no-code EDA dashboard that is:
- Intuitive to use
- Customizable for many data types
- Deployable on Streamlit Cloud
- Capable of both statistical and graphical insight generation
🗂 Dataset
- Primary Dataset Used: Heart Disease / Heart Failure Dataset
- Compatible Formats: Any CSV dataset with at least one categorical column
- Preprocessing Handled Automatically:
- Detection of dtypes (numeric vs categorical)
- Null-value inspection
- Category count and encoding (when needed for PCA)
- Dynamic sample adjustment for performance
⚙️ How the App Works
Once a dataset is uploaded, the app parses data and enables different analysis modules:
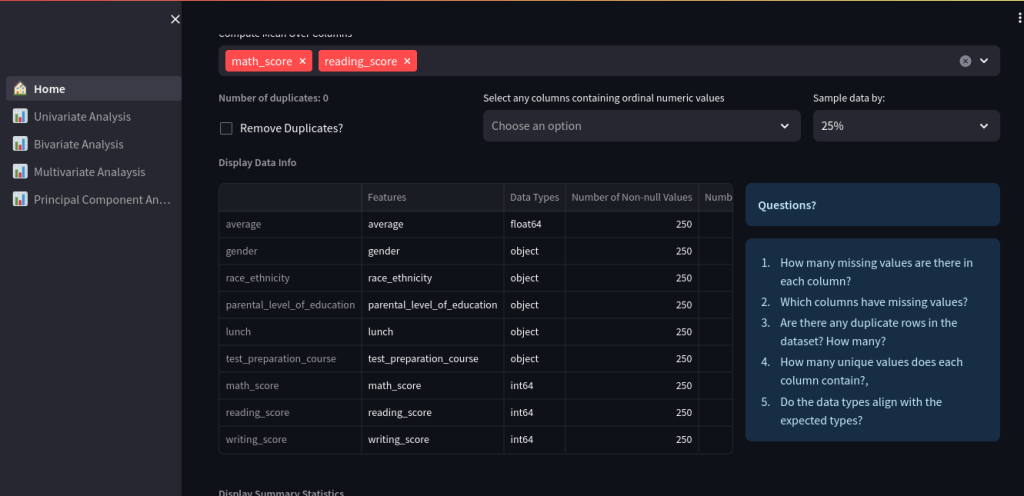
🏠 Home Tab
- Displays dataset structure
- Sample, filter, or remove duplicates
- Shows data types, nulls, and value counts
- Dynamic question prompts for user guidance
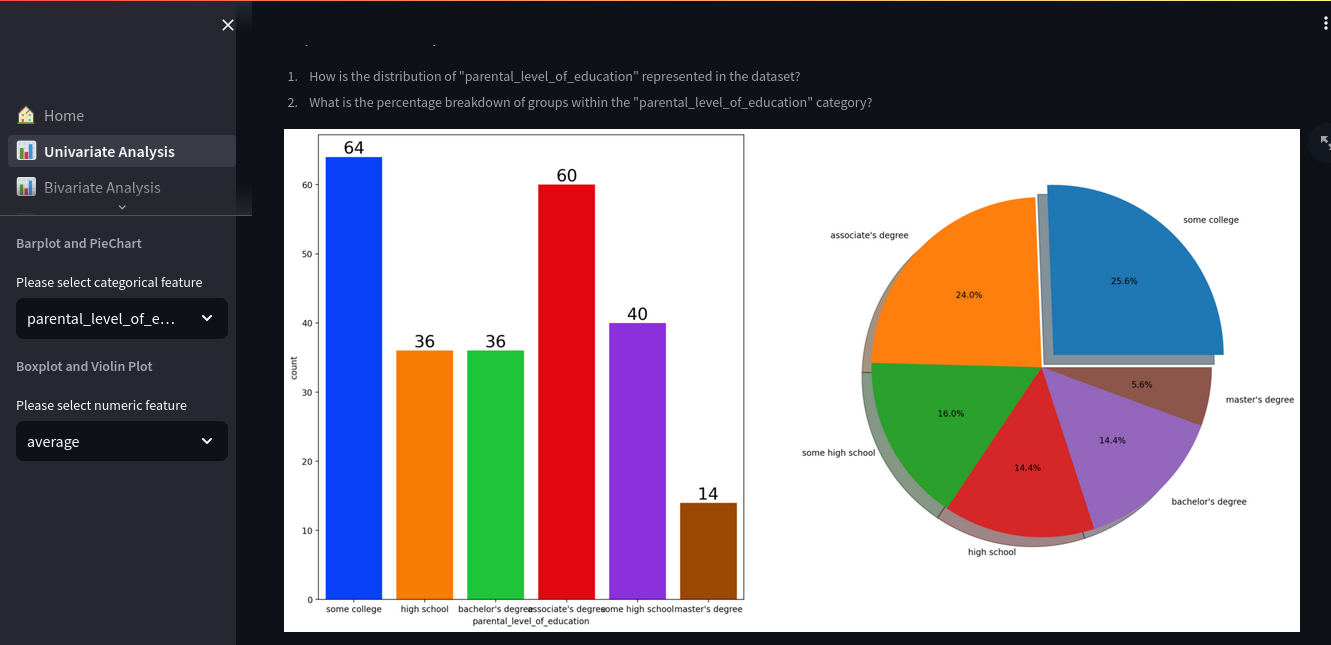
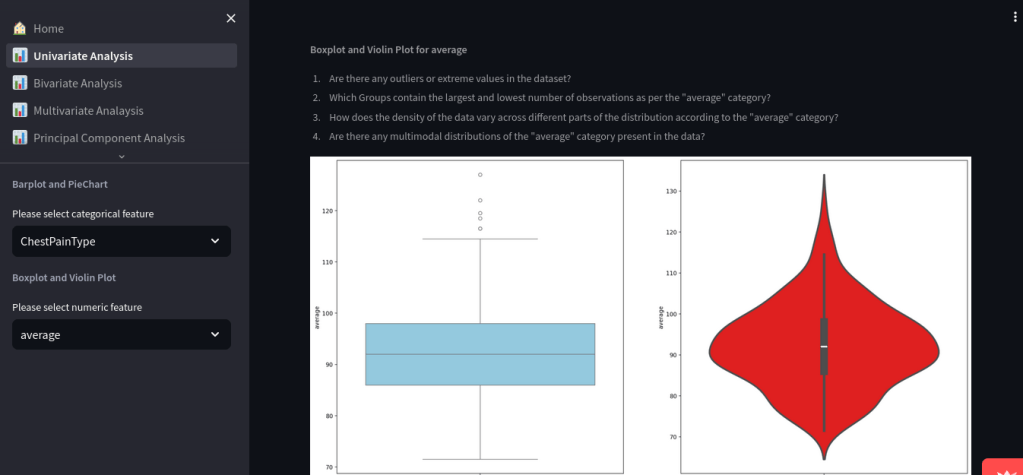
📊 Univariate Analysis
- Bar plots and pie charts for categorical distributions
- Boxplots and violin plots for numeric variables
- Questions prompt users to consider outliers, distribution shapes, and class balance
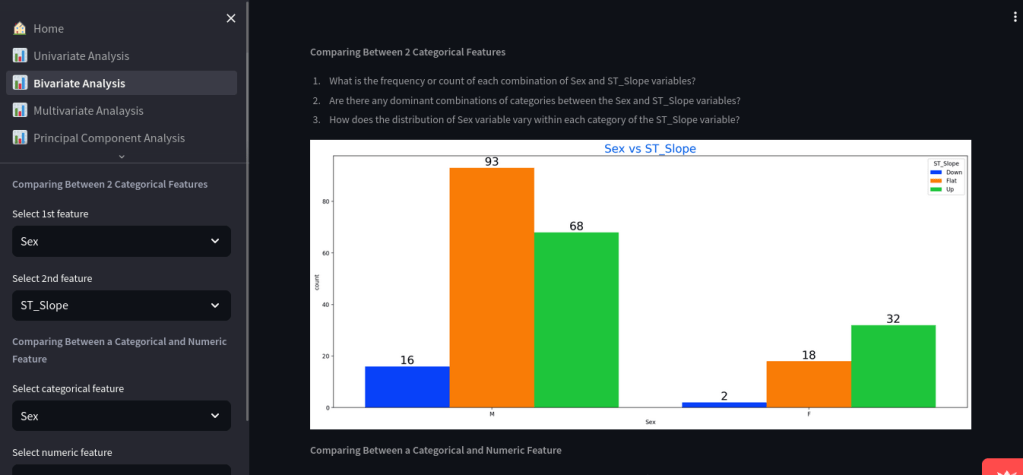
📈 Bivariate Analysis
- Compare two categorical variables or a categorical and numeric feature
- Automatically displays:
- Grouped bar plots
- Boxplots for continuous vs category
- Count distributions with insights
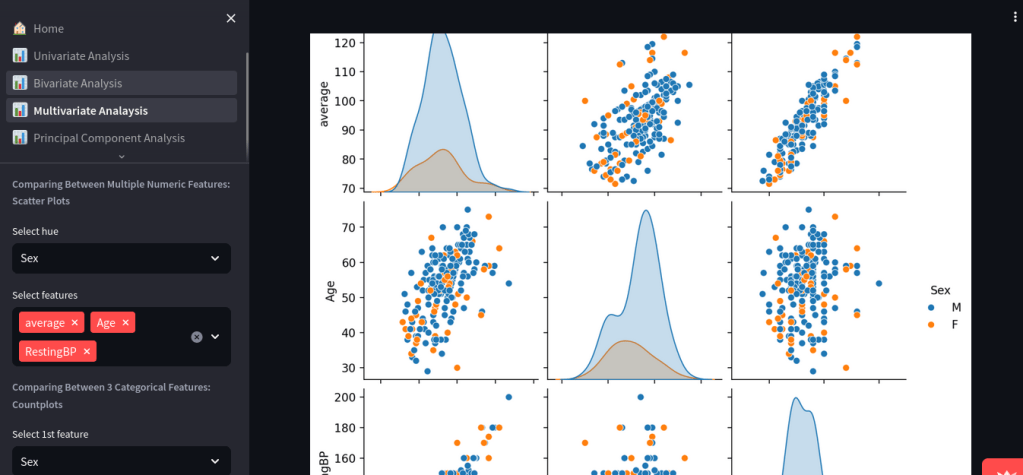
📉 Multivariate Analysis
- Explore up to 3 categorical and multiple numerical variables
- Generate scatter plots, correlation matrices, and grouped bar charts
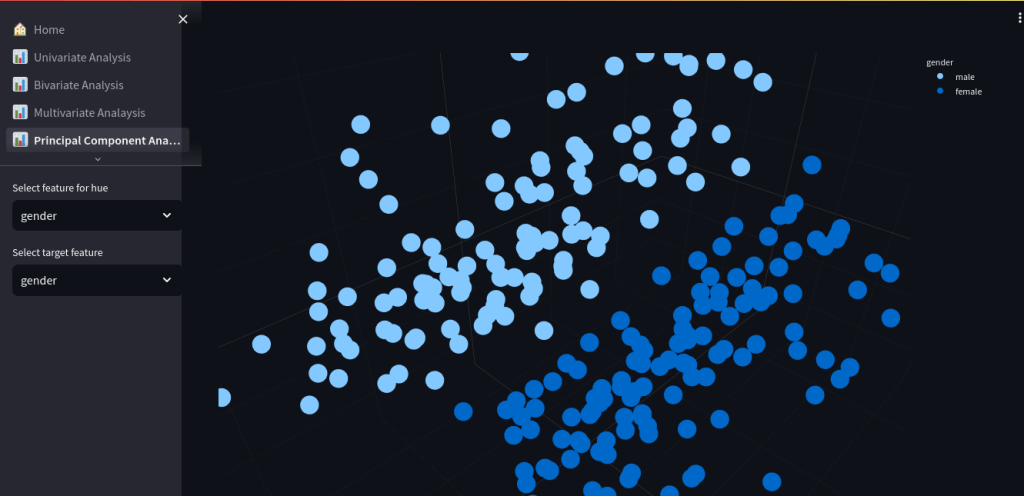
🧬 Principal Component Analysis (PCA)
- Perform PCA interactively and color projections by any categorical variable
- Displays 3D PCA plots and explained variance graphs
- Select features, choose hue and target groupings
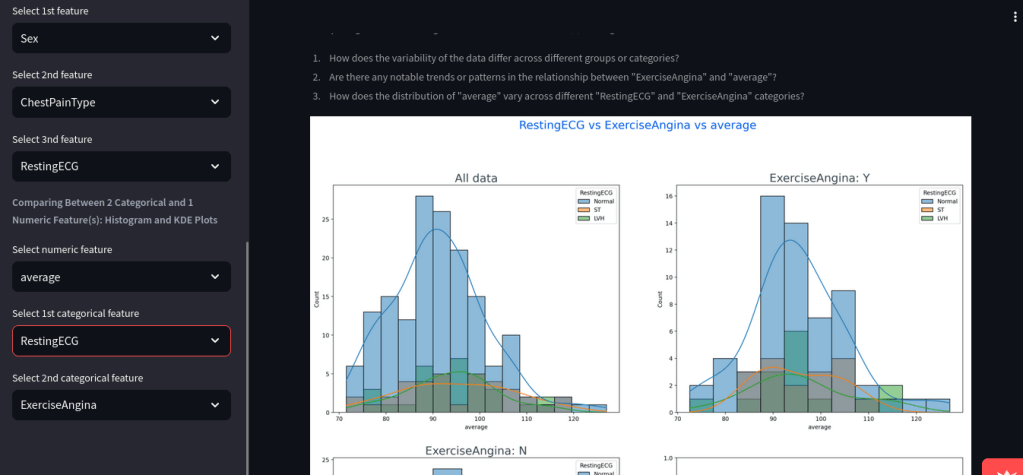
🧪 Advanced Analysis
- Built-in KDE plots for comparing continuous variables across 2 categorical groups
- Example: Resting ECG vs Exercise Angina vs average
📈 Key Results
- ✅ Built and deployed a fully functional, public EDA tool
- 🔍 Supports datasets with any number of categorical/numeric features
- 📊 Includes rich visualizations: violin plots, scatter matrices, PCA plots, and histograms
- 📁 Users can explore data without coding, empowering broader adoption of data science
💡 Lessons Learned / Innovations
- Efficient EDA requires automated handling of mixed data types
- Realized the need to limit data size for cloud hosting (1GB RAM limit on Streamlit Cloud)
- Added question-driven guidance to help less experienced users interpret plots
- Modularized code via
src/components/data_transformation.pyandutils.py
💬 Discussion
This app reimagines EDA as a guided storytelling process, not just a series of plots. It works especially well for:
- Student assignments
- Hackathon data reviews
- Medical/survey data exploration
- Exploratory steps before feature engineering
With PCA and multivariate plots, users can uncover relationships even without domain knowledge.
📣 Call to Action
If you want to explore datasets visually and quickly—try the app:
👉 Launch Dashboard
Fork the GitHub repo to customize or contribute.

Leave a comment