
Predicting Malaria Incidence from Climate Data Using Machine Learning
- Client or Institution: Research Collaboration on Malaria
- Project Goal: Develop a predictive system and visualization platform for malaria incidence based on climatic and geographical data across 98+ countries
- Tools Used: Python, Scikit-learn, CatBoost, Streamlit, Plotly
- Duration: 1 month
- Outcome: Deployed ML models for regression with a Streamlit web app for predictions and global data exploration
- Live App: Malaria Predictor Web App
- Publication: Malaria Incidence Prediction Using Climate Factors with Machine Learning Models, UBMK 2024
- GitHub: Visit Codebase
A Global Web Tool for Environmental Health Insight
Abstract
Malaria incidence is strongly influenced by environmental factors such as rainfall, temperature, and location. In this project, we developed machine learning models to predict malaria incidence based on these parameters using curated data from WHO, World Bank Climate Knowledge Portal, and Google Public Data. The models were trained on multi-year datasets from over 98 countries. Our best model (CatBoost Regressor) achieved a correlation score of 96.7%. This model powers a user-facing Streamlit app for country-specific predictions and global map visualizations.
🧠 Background & Problem Statement
With over 600,000 deaths annually, malaria remains a major global health challenge—especially in sub-Saharan Africa. Climate conditions significantly influence mosquito breeding and malaria outbreaks, but real-time tools to leverage this data for incidence prediction are limited.
This project aimed to:
- Analyze how climate (precipitation, air temperature) and geography (lat/lon) affect malaria incidence
- Train and evaluate both regression and classification models
- Deploy the best-performing model in a web app
- Offer a globally accessible tool for researchers, policymakers, and the public
🗂 Dataset
📌 Sources:
- WHO Global Health Repository: Malaria incidence data (2000–2021)
- World Bank CCKP: Monthly rainfall and temperature (1901–2022)
- Google Public Data: Country latitude and longitude
🧹 Preprocessing Steps:
- Filtered data for matching country entries
- Aggregated monthly values into yearly averages
- Created new features through pairwise interaction, mean, std, etc.
- Created a binary label: high incidence (≥10) vs low incidence (<10)
Final features included:
year,precipitation,AvMeanSurAirTemp,AvMaxSurAirTemp,AvMinSurAirTemp,longitude,latitude- Target:
incidence(for regression) orgroup(for classification)
⚙️ Approach & Methodology
Algorithms Used
Regression Models (9 total):
- Linear, Ridge, Lasso
- K-Nearest Neighbors, Decision Tree, Random Forest
- XGBoost, CatBoost, AdaBoost
Classification Models (10 total):
- Random Forest, Gradient Boosting, MLP, SVC
- Logistic Regression, XGBoost, CatBoost, AdaBoost, Decision Tree, KNN
🔬 Evaluation Metrics
- Regression: RMSE, MAE, R²
- Classification: F1 Score, Accuracy, ROC AUC
Cross-validation: 5-fold stratified
Hyperparameter tuning: GridSearchCV
Feature Engineering: Pairwise interactions, max/min/mean aggregations
Feature Selection: Recursive addition/elimination
📈 Key Results
- Best Regression Model: CatBoost Regressor (Test R²: 0.9774)
- Best Classifier: MLPClassifier (Test F1 Score: 0.990)
- Predictions closely mirrored real-world WHO data across years
- Web app includes:
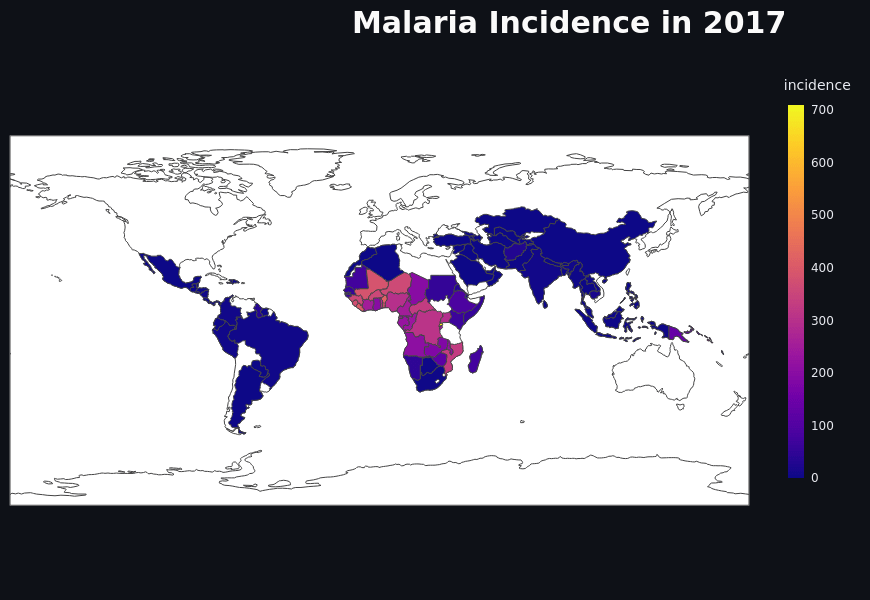
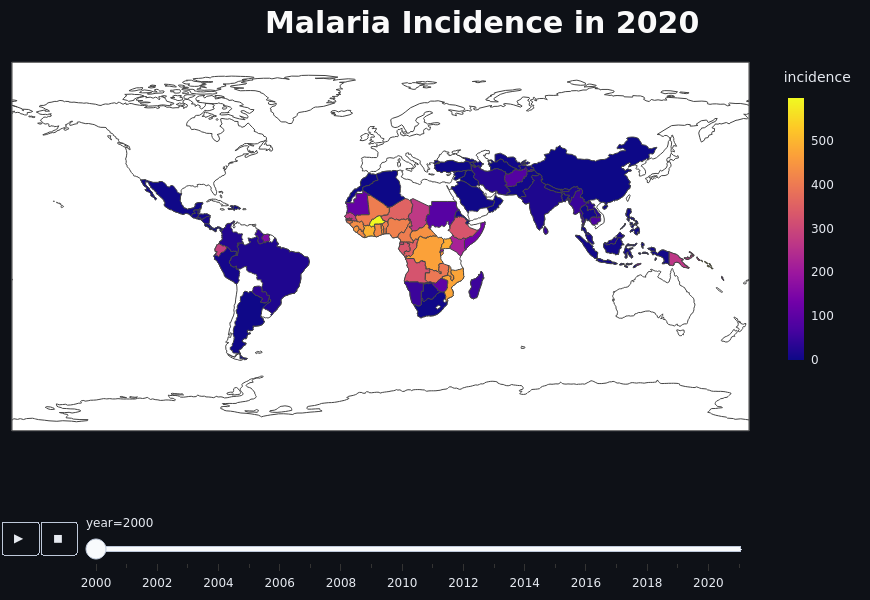
- 🌍 Interactive choropleth maps (per year)
- 🧮 Prediction panel with live model inference
- 🕹 Input sliders for temperature, rainfall, location
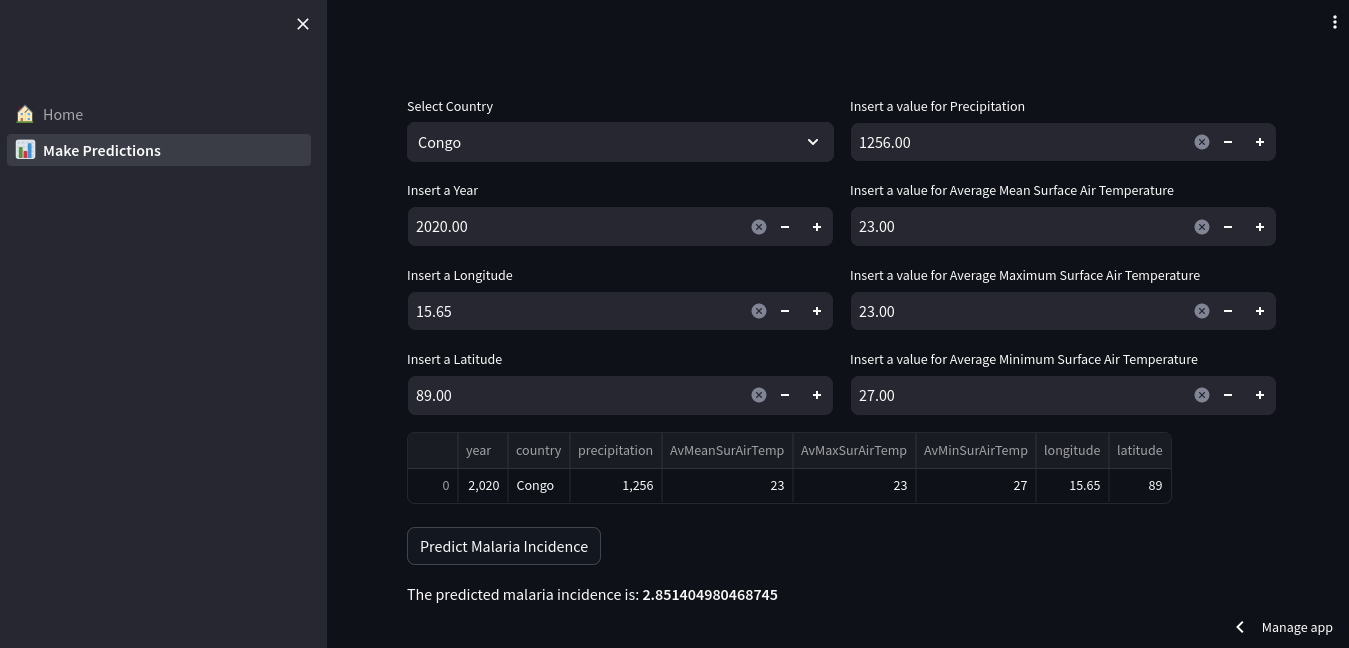
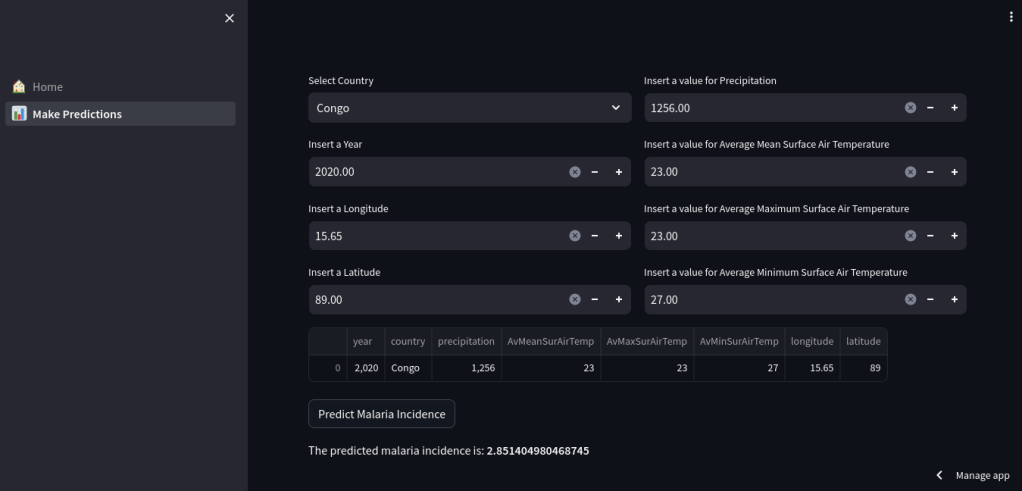
🌍 Application Features
Prediction Panel
Users can input:
- Country
- Year
- Precipitation
- Average/Max/Min surface temperatures
- Location (lat/lon)
And get predicted malaria incidence.
🗺 Interactive Map
Choropleth maps of actual vs predicted malaria incidence across years. Users can animate across 2000–2020.
💡 Lessons Learned / Innovations
- Feature selection improved interpretability but not always model performance
- Normalization had marginal benefit—especially for linear models
- Model accuracy dropped significantly when removing
yearorcountryfrom features - Feature engineering boosted performance for tree-based models, especially CatBoost
💬 Discussion
This project demonstrates how environmental datasets can be used to predict malaria burden with high accuracy. Unlike black-box epidemiological models, this ML-driven approach is transparent, testable, and scalable.
Its greatest strength lies in its accessibility: anyone can simulate future scenarios or test real-world conditions using the live app.

Leave a comment